PV Cable Sizing Part Three: When and When Not to Follow NEC Conductor Rating Tables
- Castillo Engineering
- Mar 10, 2023
- 9 min read
By Joe Jancauskas, Senior Electrical Engineer at Castillo Engineering

First published in 1897, the National Electric Code (NEC) has been adopted regionally throughout the U.S. for decades to ensure the safe installation of electrical wiring and equipment, including through conductor rating tables. In fact, the NEC still has the most widely used design criteria for sizing cables for PV systems due in part to the plethora of useful tables it provides that serve to simplify PV cable sizing. The PV cable sizing tables and design criteria the NEC offers are particularly useful when:
You have a rush schedule to complete a design
Commodity prices are low and any inherent conservatism in the design criteria does not have a significant financial impact
You want to reduce the number of questions from people who sometimes don’t fully understand electricity and would prefer to follow a rigid playbook
However, how often do the NEC’s tables for conductor sizing actually need to be followed - always, only when the AHJ is looking, or never? Below we provide an introduction to the NEC’s conductor sizing tables; cover how rigid the NEC ampacity values are, the NEC’s load factor assumptions, as well as buried circuit issues, circuits in cable tray issues, and solar peak power output that must be factored into real world cable sizing.
Introduction to the NEC’s Tables for Conductor Sizing
When it comes to PV installations, many jurisdictions are still using the 2017 NEC, where the main cable ampacity reference for solar raceways is Table 310.15(B)(16). More experienced PV designers will remember the uproar which took place in 2011 when the well known Table 310.16 was retitled “Table 310.15(B)(16)” in a major reorganization of the NEC. Many jurisdictions did not adopt the new edition because of the numerous changes, and the table heading up through 2017 had to include the note “(formerly Table 310.16)”. With the 2020 edition of the NEC, this table has been renamed back to its old, well known title of 310.16.
While the above table applies to solar raceways, Table 310.17 applies to installations in free air. Also, Table 310.20 is used for installations on a messenger wire, and numerous tables in Article 315 for medium voltage are used for installations in an underground duct bank. In several circumstances, these tables can result in a cost efficient design.

How Rigid Are The NEC Ampacity Values?
The ampacity values listed in the current revision of the NEC have been fairly fixed as of late, but that has not always been the case. “Since 1889, many individuals and organizations have attempted to find the correct ampacity for conductors so they would not overheat and ruin the insulations. In 1889, one of the first tables listed 46 amperes as the ampacity of a #10 conductor. In 1890, it was listed 19.1 amperes, and in 1894, the insurance industry listed 20 amperes as the ampacity for the same conductor. But that was not the end of it. By 1937 there were 16 ampacities discovered for the same size conductor.”1
In 1938, S. J. Rosch of the Anaconda Wire and Cable Company conducted a thorough investigation to find the ‘correct’ ampacities for all of the standard size conductors used at that time, resulting in an IEEE paper published in 19382, for which the ampacities of two cable sizes have been excerpted below:

While the wide spread in ampacity values is interesting, it is important to note that none of the values are incorrect; It is just that they are based on different sets of conditions, thereby making them all correct in their own way. As summarized in 19903, if you want to make a standard table of ampacity values, the following mostly complete list gives an idea of the assumptions that need to be baked into each single value. The headings of the NEC tables are so long because they need to define as many of these parameters as possible:
1. Load current 2. Utilization voltage 3. Continuous or noncontinuous load 4. Voltage drop - continuous and inrush 5. Length of circuit 6. Ambient temperature along length of circuit 7. Conductor material - copper or aluminum 8. Raceway - conduit, wireway, tray, etc. 9. Raceway - magnetic or nonmagnetic 10. Single or three-phase 11. Environment - dry, damp, wet 12. Location-free air, buried, duct bank, etc. 13. Equipment termination temperature limits 14. Shielded or non-shielded 15. Insulation temperature limitations 16. Routing - pulling tensions, bends, etc. 17. Demand factors 18. Number of current-carrying conductors 19. Total number of conductors 20. Type of insulation 21. Load type - lights, motors, capacitors, etc. 22. Ambient temperature in enclosures 23. Effect of voltage drop on ground size 24. Overcurrent device - 80% versus 100% rating 25. Paralleling of conductors 26. Next higher standard device rating 27. Overcurrent device-fuses, CB, MCP, etc. 28. Equipment grounding conductor size 29. Neutral conductor loading and size 30. Meaning of “ambient temperature” over time 31. Allowance for load growth 32. Short circuit available and rating 33. Load factor -12 or 24-hour operation 34. Energy cost of circuit I2R losses (and the trade-off between initial capital cost and the time-value of the losses, see some good examples at Reference4) 35. Service, feeder, or branch circuit 36. Maximum terminal conductor size 37. Short time ratings 38. NEC, NESC, NRTL, local codes, etc. 39. Effects of load on current waveform, 40. Diversity 41. Environment-corrosive fumes, vapors, etc.
The single values in each of the NEC tables must take into account, or ignore, each of the 41 items listed above so they actually only truly apply to a very narrow range of defined installation parameters. The near universal NEC Table 310.16 works most of the time, but in order to do so, it therefore ends up being conservative most of the time. This conservatism fits well with the NEC’s overall goal to provide the minimum cable size requirements to prevent overheating and fire, but is “not necessarily efficient, convenient, or adequate for good service,” as stated in Article 90.
The following custom, non-PV example is the result of clearly defining a large number of the above parameters while also solving for the maximum allowable distance for a 2% voltage drop so that design personnel would not need to keep running voltage drop calculations ad infinitum for relatively short cable runs:

The assumptions can keep getting bundled together until you end up with a really short, useful table of ampacities such as this one seen at a major hardware store:

Just because something is in the NEC doesn’t necessarily mean that it will stand the test of time. PV designers will be well familiar with the 2008 NEC addition of a table in section 310 which required temperature “adders” be made to the ambient temperature that varied with the distance from the roof surface. While this initial change was based on conducted tests, a later special task force determined that the table was not actually required, so it was deleted in 2017 and replaced by a 60oF adder for installations within 7/8” of a rooftop, saving a lot of unnecessary copper in the process. In sum, ampacity values varied quite a lot 100 years ago and they are still significantly varying this decade.

Load Factor
The formal IEEE definition of load factor is “the ratio of the average load in kilowatts supplied during a designated period to the peak or maximum load in kilowatts taking place in that period. Load factor, in percent, also can be derived by multiplying the kilowatt hours (kWh) in the period by 100 and dividing by the product of the maximum demand in kilowatts by the number of hours in the period.”
It’s important to keep in mind that the NEC tables assume a 100% load factor, and PV is considered a continuous load per 690.8(B), despite solar irradiation constantly varying throughout the day. Castillo Engineering has, however, recently done a 3 MW ground-mount PV system with a high dc/ac ratio, single axis trackers, bifacial modules, and string optimizers which PVSyst indicates could hit a continuous ac inverter full nameplate output of up to 12 hours a few days out of the year. The assumption is conservative, and more real world conditions can be utilized via the several NEC permissions for engineered designs.
A real world example of the calculated load factor for a PV system is shown below. Notably, the load factor is quite a bit less than 100% - around 22% to 32%, depending on the time of year.

Buried Circuit Issues
So how conservative does this 100% load factor assumption make the NEC? The 3,054 pages of IEEE Power Cable Ampacity Tables5 give an indication, since they provide both 100% and 75% load factor values.
For a low voltage, direct-buried underground circuit, using the applicable, most popular NEC table shows an ampacity that is quite conservative when compared with IEEE specific application ratings:

When it comes to medium voltage circuits in duct banks, the NEC 100% load factor values are much closer to the IEEE values:

Much has been written about the NEC ampacity assumptions with a good discussion posted online by a software vendor 6. When faced with real world conditions that differ from the assumptions baked into a table, it is better to utilize a software program than try and fight through the Neher-McGrath 7 heat transfer equations developed in the 1950s for calculating cable ratings.
Circuits in Cable Tray Issues
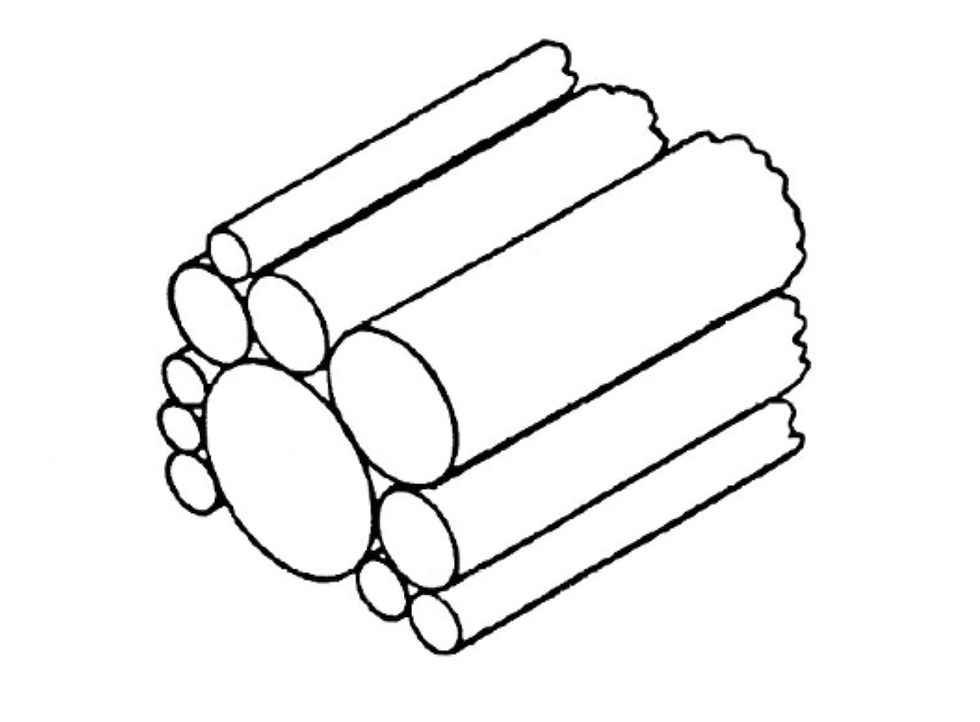
Cable Tray Article 392 in the NEC requires a minimum 1/0 size conductor arranged in a single-lay configuration. A lot of U.S. facilities did not see these restrictions as an unfortunate ‘hard stop’ regarding the use of a cable tray for other conditions and simply did what made engineering sense, as have many PV installations. Beyond the narrow world of the NEC tables, there is the National Electrical Manufacturers Association (NEMA) standard “Ampacities of Cables Installed in Cable Trays,” 8 which goes down to #14 AWG conductor size and calculates ampacities for cables stacked up to three inches in depth. It even published papers on “Ampacities for Cables in Randomly Filled Trays,” 9 which considers “randomly laid, closely packed” cables of varying diameters, such as shown below:

Solar Peak Power
By definition, peak solar output isn’t just going to occur during the hottest temperature conditions because module power output declines with increasing temperature for both crystalline and amorphous silicon cells due to their negative Temperature Coefficient of Voc, as detailed on their data sheets. Therefore, when it is a mild 25oC (77 oF) outside, the actual cell temperature of the thin dark wafers roasting in the sun can be expected to be approximately 55-65 oC (131-149 oF), for a reduced power output of approximately 15% for the latest versions of both crystalline and amorphous modules. The standard design assumption of the highest load/highest power happening during the hottest conditions is one large source of conservatism for PV design.
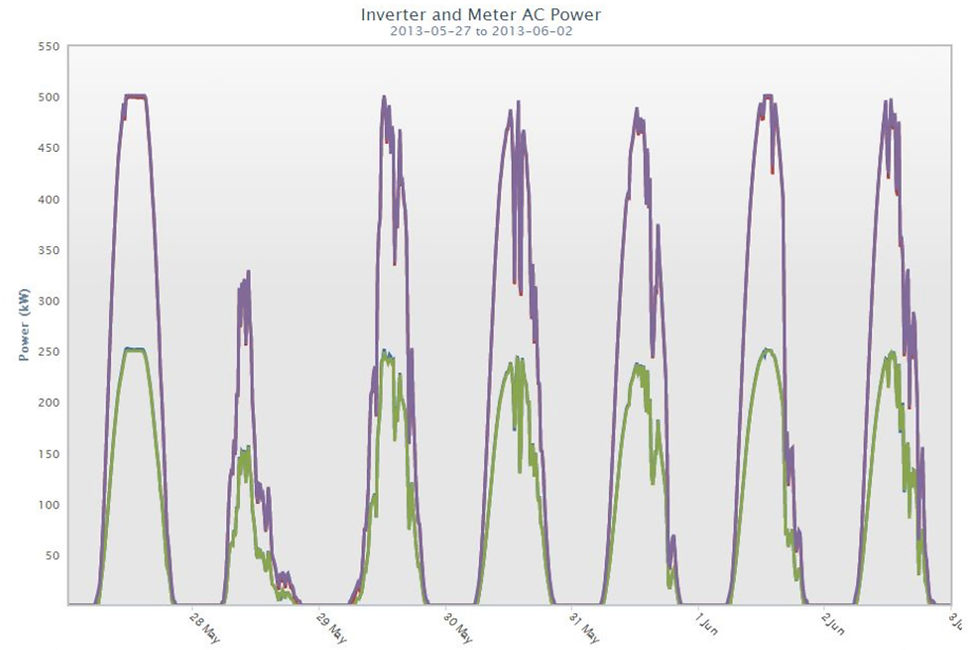
In the following example, Castillo Engineering had a client who wanted to ensure that his PV power output was never ‘clipped’ by the inverter rating. The system was commissioned in early spring, and the output graph below shows an excerpt of the highest power output achieved in the first 6 months of operation. On May 27, there was just the tiniest amount of clipping at solar noon when the temperature was 70oF with steady winds gusting to 20 mph. With PV module warranties only guaranteeing 97% of output at the end of the first year, that plus a little soiling will ensure that the initial few kWh of clipping shown in the graph of the initial operation will not be seen again. The highest PV output is typically on a cool, windy, late spring day.

So When Should You Follow or Not Follow the NEC’s Tables for Conductor Sizing?
It should be evident by now that power cables do not have fixed ‘ratings,’ as every published rating is based on a voluminous set of assumptions which are unlikely to exactly match your particular application. Therefore, getting hung up on an amp or two here or there is not technically important, although it may be important to someone who strictly adheres to the NEC codebook regardless of real world applicability. In a similar manner, transformers do not have ratings either, since their nameplate is also based on 24/7/365 operation for 40 years at an ambient temperature of 30 oC. The end of life for both cables and transformers is based on the degradation of their organic insulating materials, but this rather arduous heat-based calculation has been practically replaced by the analog of fixed ampacity values.
That being said, when should the NEC tables for conductor sizing be followed? The main scenario would be when you need a quick, conservative, one-size fits all design that does the job, but may not fit as well as you’d like. The situations in which you should not follow these tables would be when you would like a better, bespoke fit for your project whose quality will pay off both initially and over time.
If you have any questions about PV cable sizing, voltage drop or otherwise, get in touch with one of our engineering experts today.
Sources:
1. Tom Henry’s web site https://www.code-electrical.com/Undergound%20sample.pdf
2. The Current-Carrying Capacity of Rubber-Insulated Conductors, S. J. Rosch, Transactions of the American Institute of Electrical Engineers, Vol. 57, Issue 3, 1938
3. NEC Ampacity Tables, Circuit Sizing, and Developing Standardized Tables, Richard A. Fuselier, IEEE Transactions on Industry Applications, Vol. 26, No. 3, May/June, 1990
4. Dc Voltage Drop, Mayfield, Gibbs, Grana, Solarpro Magazine, May/June 2015
5. IEEE Standard Power Cable Ampacity Tables, IEEE Std 835-1994
6. Underground Cable Ampacities and the NEC Code, Calcware, https://www.calcware.com/?page_id=99
7. The Calculation or the Temperature Rise and Load Capability of Cable Systems, J. H. Neher, R M. H. McGrath, Transactions of the American Institute of Electrical Engineers. Part III: Power Apparatus and Systems, Volume: 76, Issue: 3, 1957 (Note to Reader: This paper contains heavy-duty math and is not very readable, even for someone with a B.S. degree in electrical engineering)
8. ANSI/NEMA WC 51/ICEA P-54-440-2009 (R2014, R2019), Ampacities of Cables Installed in Cable Trays
9. Ampacities for Cables in Randomly Filled Trays, J. Stolpe, IEEE Transactions on Power Apparatus and Systems, Volume: PAS-90, Issue: 3, 1971
Comments